
Most eCommerce store owners are obsessed with bringing in more traffic, but traffic alone doesn’t guarantee sales. What truly drives growth is your ability to turn those visitors into paying customers. That’s where conversion comes in.
A healthy conversion rate signals that your store design, product pages, and customer journey are working together to guide visitors toward completing a purchase. While many business owners think of conversions only in terms of sales, other actions like joining a waitlist, signing up for a newsletter, or adding products to a cart are just as important. These smaller steps, often called micro-conversions, help move shoppers closer to becoming loyal customers.
In this guide, we’ll break down what eCommerce conversion really means, explore the different types you should track, look at benchmarks to understand how your store compares, and share practical strategies you can apply without feeling overloaded.
The goal is to help you see conversion as more than just a percentage. It’s the entire process of shaping a seamless shopping experience that turns more of your visitors into long-term, repeat customers.
Let’s get started!
What is eCommerce Conversion? Why Does it Matter?
An eCommerce conversion happens when a visitor takes a specific action that moves your business forward. The most obvious and important example is a purchase, but conversions aren’t limited to sales alone.
Actions such as adding a product to the cart, creating an account, signing up for your email list, or joining a waitlist for out-of-stock items all count as conversions because they show intent and bring customers closer to buying.
Your conversion rate is a simple metric that reflects how effective your store is at turning visitors into customers. It’s calculated with a straightforward formula:
Conversion Rate = (Total Conversions ÷ Total Visitors) × 100
For example, if your store receives 1,000 visitors in a month and 40 of them make a purchase, your conversion rate is 4 percent.
Understanding conversions goes beyond the numbers. Leads, such as someone signing up for your newsletter, are early signals of interest, while conversions like a completed checkout represent final goal actions. Tracking both gives you a complete picture of how visitors move through your funnel.
It also helps to distinguish between macro and micro conversions.
Macro conversions are your primary goals, such as sales or completed checkouts. Micro conversions are the smaller steps, like adding items to a wishlist or filling in an email form, that pave the way toward those bigger outcomes.
Together, these actions show you not just how many customers you’re winning but also how effectively your store guides people along the journey from first visit to final purchase.
What are the Different Types of eCommerce Conversion Rates?
When most people think about conversions, they picture a sale. While sales are the most important metric, there are several other types of conversions that reveal how visitors interact with your store. Tracking these different rates helps you identify friction points, measure intent, and understand where your funnel may need improvement.
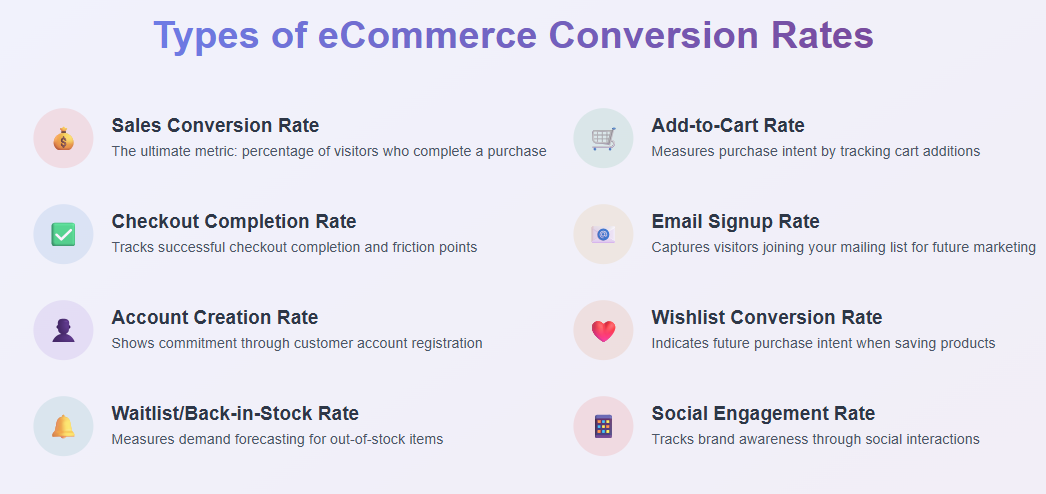
- Sales Conversion Rate: The percentage of visitors who complete a purchase. This is the most critical conversion rate because it directly reflects revenue and store performance.
- Add-to-Cart Conversion Rate: Measures how many visitors add products to their shopping cart. Even if they do not complete the checkout, this action shows purchase intent and helps you understand product appeal.
- Checkout Conversion Rate: Tracks the percentage of shoppers who begin checkout and successfully complete it. A low checkout conversion rate usually signals friction, such as hidden costs, limited payment options, or too many steps in the process.
- Email Signup Conversion Rate: Represents how many visitors join your mailing list. Since email remains one of the highest-converting marketing channels, building your list is an important way to nurture leads and drive repeat sales.
- Account Creation Conversion Rate: Shows how many customers choose to register an account on your site. While guest checkout is essential for reducing barriers, accounts make repeat purchases easier and allow for more personalized experiences.
- Wishlist Conversion Rate: Tracks how often visitors save products to a wishlist. This type of conversion signals future intent and gives you insight into popular items that may not be purchased immediately.
- Waitlist or Back-in-Stock Conversion Rate: Measures how many people sign up to be notified when an out-of-stock product becomes available. This is valuable for forecasting demand and planning inventory.
- Social Engagement Conversion Rate: Includes actions such as following your brand on social media, sharing content, or clicking through from social posts. While not tied directly to sales, these conversions increase brand awareness and build long-term customer relationships.
By monitoring each of these conversion rates, you can see more than just how many sales you are making. You also gain visibility into how customers move through your store, where they hesitate, and how you can create a smoother path from browsing to buying.
Key Factors That Influence Conversions
Every store is different, but the reasons customers decide to buy or walk away are often the same. Understanding these factors helps you pinpoint what supports conversions and what pushes visitors out of the funnel.
Speed is one of the biggest influences. Even a second of delay can cause customers to leave, making site performance a top priority. Mobile optimization is equally important. Since mobile users typically convert at lower rates than desktop users, a responsive design with simple navigation is essential.
Checkout is another common barrier. If the process feels long or confusing, carts are abandoned. Guest checkout, clear pricing, and multiple payment options help reduce friction. Strong product pages also make a difference. High-quality images, videos, detailed descriptions, and reviews give shoppers confidence to move forward.
Trust is a critical driver. SSL certificates, secure payment logos, and authentic customer testimonials show that your store is safe. Competitive pricing and incentives such as free shipping or limited-time offers provide an extra push to complete purchases. Clear menus and effective search also matter, keeping the experience smooth.
Finally, personalization and accessible support round out the list. Tailored recommendations make the shopping journey feel relevant, while quick answers through live chat or chatbots help customers complete their order.
Focusing on these areas creates a store that feels reliable and customer-first — qualities that consistently raise conversion rates.
How to Track & Calculate Conversion Rates
Tracking conversions can feel overwhelming at first, but breaking it into steps makes the process easier to follow. Here’s how to set it up in a way that gives you useful, reliable data.
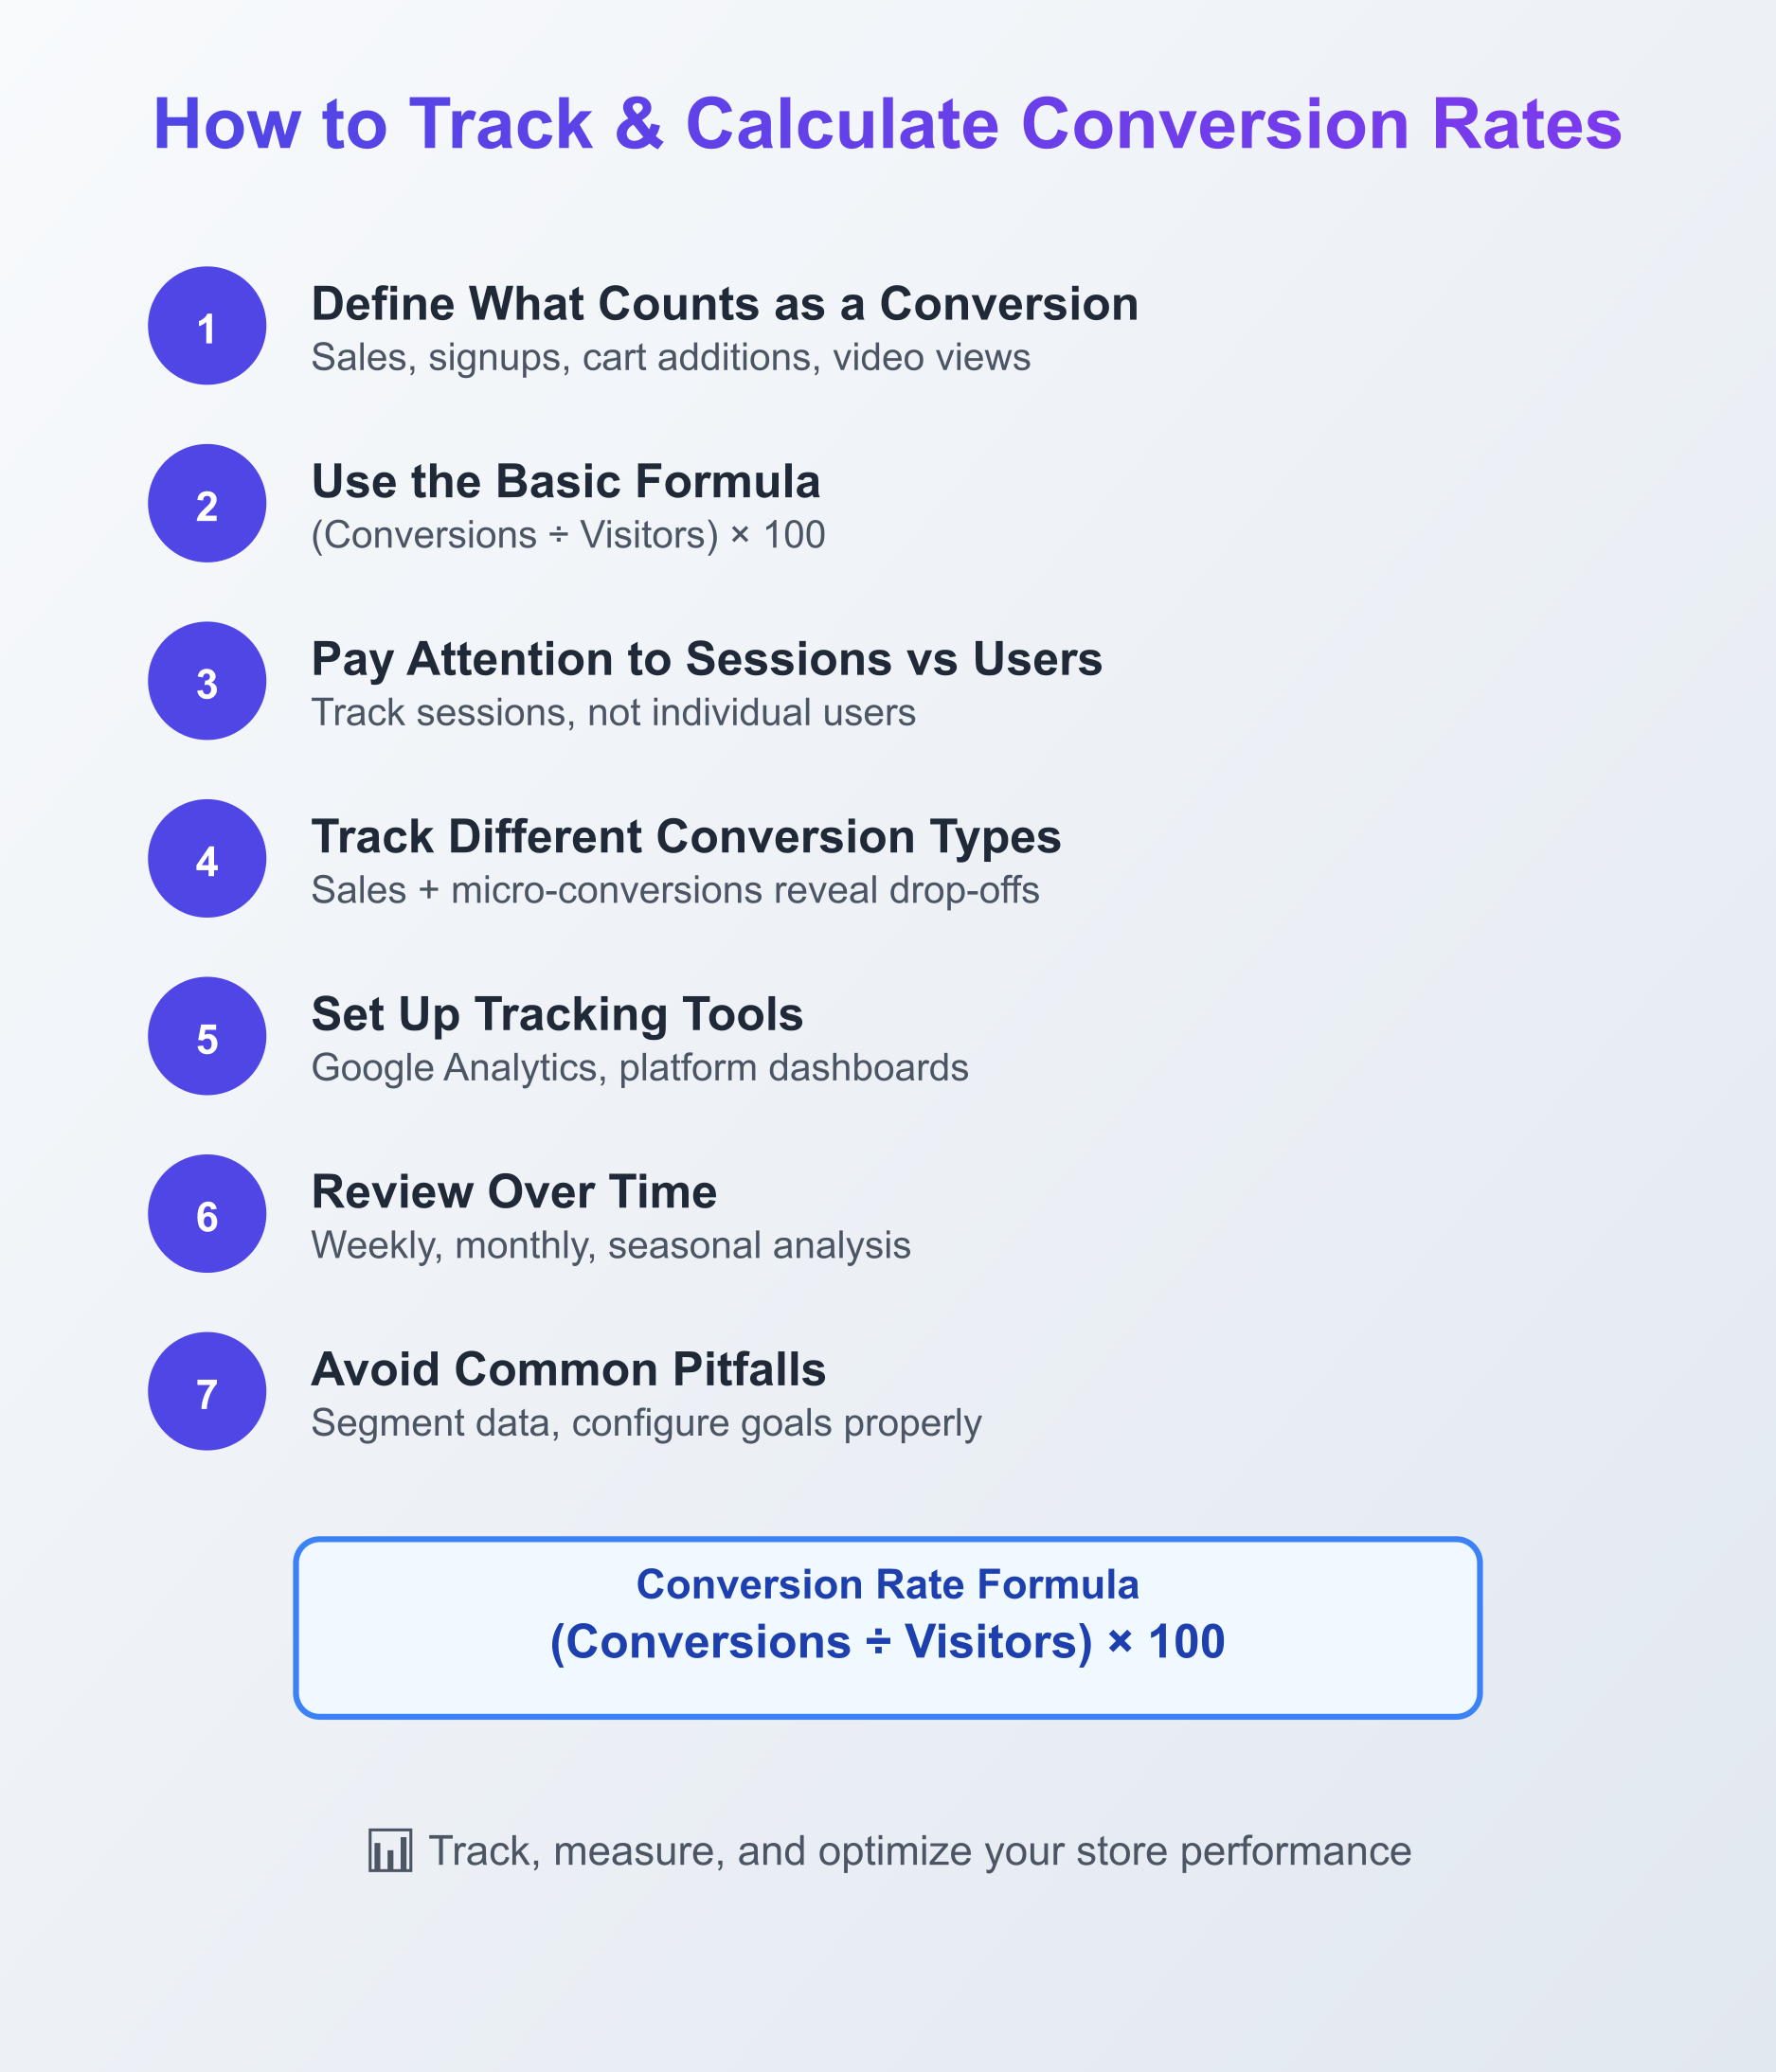
Step 1: Define What Counts as a Conversion
For most stores, a sale is the obvious choice, but that’s not the only goal worth tracking. You might also want to measure signups for your newsletter, people who add products to their cart, or even visitors who watch a product video.
Deciding this upfront ensures your numbers reflect the actions that actually matter to your business. Many successful stores track both major and minor actions so they can see how customers move from awareness to purchase.
Step 2: Use the Basic Formula
The math is simple: Conversion Rate = (Total Conversions ÷ Total Visitors) × 100.
If 1,000 people visit your store and 50 buy, your sales conversion rate is 5 percent. The same formula works for other actions. For instance, if 200 out of 2,000 visitors sign up for emails, your signup conversion rate is 10 percent.
Over time, comparing these different rates helps you understand whether marketing campaigns are improving interest, checkout flow, or both.
Step 3: Pay Attention to Sessions vs Users
Analytics platforms usually count sessions, not individual users. One person who visits three times is three sessions, not one. This may feel counterintuitive, but it reflects reality since most shoppers need multiple visits before buying. If you measure by users, your conversion rate will look higher than it really is, which makes it difficult to identify leaks in your funnel.
Step 4: Track Different Conversion Types
Sales rates tell you how much money is coming in, but micro-conversions reveal where customers are dropping off. If lots of people add items to their cart but few complete checkout, you know exactly where to focus. Looking at overall site conversion rates alongside these smaller signals gives you a much clearer picture of performance.
Step 5: Set Up Tracking Tools
Google Analytics is still the go-to for many, but your ecommerce platform may already have built-in reporting.
Shopify, WooCommerce, and BigCommerce all offer dashboards that track orders, cart activity, and other key events.
Tools like Hotjar or Lucky Orange add another layer by showing how visitors actually interact with your site through heatmaps and session recordings. These insights are particularly useful when deciding whether to redesign a checkout page, reorganize navigation, or test new product imagery.
Step 6: Review Over Time
Conversion rates are not static. They fluctuate with seasons, sales, and campaigns.
Looking at weekly numbers is useful for spotting sudden drops, while monthly and quarterly views show broader patterns. Seasonal businesses especially benefit from comparing year-over-year data rather than just week-to-week changes.
Long-term tracking helps you separate genuine problems from temporary noise, like a holiday promotion skewing results.
Avoid These Common Pitfalls
Many store owners make the same mistakes:
- Mixing up users with sessions.
- Ignoring device differences.
- Failing to set up goals correctly in analytics.
These small errors can distort your numbers and lead you to make the wrong changes.
Another common oversight is failing to segment data. Tracking mobile visitors separately from desktop users, or first-time customers separately from returning ones, often reveals opportunities that would otherwise be hidden in the averages.
Taking the time to configure tracking properly pays off in more accurate insights.
When you follow these steps, you not only know your conversion rate but also gain a reliable foundation for making smarter improvements across your store.
What Are the eCommerce Conversion Benchmarks in 2025
Benchmarks provide context for how your store compares to others in the market. While averages vary by industry, device, region, and traffic source, they give you a useful reference point to see whether your store is underperforming or performing above average.
| Industry/Metric | Conversion Rate Benchmark | Notes |
| Overall Global Average | 1.7% – 1.9% | Average from Shopify and MobiLoud sources (see end of article) |
| Shopify Stores Average | 2.5% – 3.0% | Top 20% stores exceed 3.2%, top 10% exceed 4.7% (Shopify) |
| Retail (Fashion, Jewelry, Shoes) | 1.6% – 1.9% | Fashion and apparel around 1.6% to 1.9% (DeveloDesign) |
| Electronics & Home Appliances | 3.6% – 4.5% | Electronics conversion rates (DeveloDesign) |
| Personal Care Products | 4.9% – 6.8% | High conversion rates due to repeat purchases (DeveloDesign) |
| Food & Beverages | ~4.9% | Consumables drive higher conversion rates (DeveloDesign) |
| Beauty/Wellness | Up to 6.8% | Strong loyalty and repeat purchases (MobiLoud) |
| Checkout Conversion Rate | 29.5% – 61.9% | Average ~45.7% (IconicWP) |
| Add-to-Cart Rate | ~7.5% – 7.7% | Typical range from Shopify and MobiLoud |
| Cart Abandonment Rate | ~71.3% overall | General abandonment rate, mobile rates not specifically from these sources |
| Device Conversion Rates | Desktop: 3.9% – 4.8%Mobile: 1.5% – 2.9% | Desktop conversions are higher, though mobile traffic dominates (MobiLoud, Shopify) |
These numbers show that conversion performance varies widely depending on what you sell, where your customers are, and how they find you. Global averages are helpful, but the best comparison is against your own historical performance and other businesses in your niche. Even small gains above your industry average can translate into meaningful revenue growth.
Conclusion
Improving eCommerce conversions is one of the most effective ways to grow revenue without pouring more money into ads or traffic. By tracking the right metrics, comparing your performance against realistic benchmarks, and making targeted improvements, you create a shopping experience that feels fast, trustworthy, and relevant to your customers.
Remember that conversions are not just about final sales. Micro-conversions such as email signups, wishlists, and cart additions are equally important because they show intent and move visitors closer to buying. Paying attention to both macro and micro actions helps you see the full customer journey rather than just the end result.
The stores that succeed are the ones that treat conversion optimization as an ongoing process. Regularly testing changes, refining product pages, improving checkout, and building trust all contribute to steady, compounding growth. Even small percentage increases can make a big difference when applied across all your traffic.
With consistent attention to these details, you can transform casual visitors into repeat buyers and build a store that grows stronger with every improvement.